Gantt charts are a common project management tool that allow project managers to visualize a project’s sequence of tasks that must be completed to deliver a project. Managers must plan these tasks well to deliver the project successfully and within budget, and if you use Salesforce as your CRM, you might be wondering the best way to create a Salesforce Gantt Chart.
If you’re using Salesforce for your project management needs, here’s why you need Gantt chart software to take your projects to the next level.
Salesforce Gantt Charts, the history and how to use them
What are Gantt Charts?
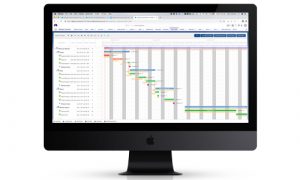
A Gantt chart is one of the most popular and practical ways of displaying project activities (tasks or events) against time. This horizontal chart visualizes your entire project schedule over time.
A list of all the tasks and milestones is displayed on the left of the chart, while the timeline is at the top. Each task is represented by a horizontal bar, which clearly shows start and finish dates, duration, and how much work on the task is already completed. The length of each bar represents the amount of time allotted to that task.
A Gantt chart gives you a clear view of:
- All tasks, subtasks, and milestones
- Start and end dates for each task
- The duration of each activity is scheduled to last
- Where activities overlap with other activities, and by how much
- How your activities are connected and dependent on each other
- The start and end date of the whole project
Gantt Chart History
Karol Adamiecki, a Polish engineer, created the first Gantt chart in the mid-1890s. Adamiecki invented “harmonogram” to display processes in production schedules. However, the Gantt chart is named after and credited to Henry Gantt, an American engineer and project management consultant, who devised his version of the chart about 15 years after Adamiecki. Gantt’s version became popular in western countries and is used to date.
Initially, people prepared Gantt charts manually. Whenever there was a change in the project, the chart had to be amended or redrawn. This laborious process limited their usefulness because continual change is common for most projects. However, with the emergence of technology and project management software, you can maintain an up-to-date Gantt chart in real-time with little effort.
Salesforce Gantt Chart Software
While Salesforce is a great CRM solution, it does not offer built-in project management functionality, and therefore it isn’t possible to generate Gantt charts in Salesforce.
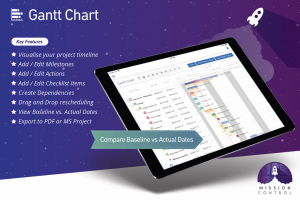
Fortunately, several project management apps on AppExchange support the Salesforce Gantt Chart feature, such as Mission Control.
Integrating your SalesForce software with Mission Control allows you to bring all your projects together in one platform. The app is straightforward to use and supports advanced Gantt features such as project planning, multiple task dependencies, milestones, baseline, file export, project cloning, and much more.
8 Benefits of Using a Salesforce Gantt Chart
The most significant benefit of a Gantt chart is being able to visualize the scope of projects and planning realistic milestones.
Here are additional reasons why you should integrate project management software that includes Gantt chart functionality into your Salesforce platform:
1. Simple to use
While many project management tools may be complex to use, a Gantt chart is simple to create and update. One needs to add a task list and the start and finish dates, and the chart will automatically plot the tasks over time. Once you set up task dependencies, your Salesforce Gantt chart will be automatically recalculated in real-time whenever changes occur.
2. Visualize your entire project progress in one place
A complex project comes with numerous components. From multiple stakeholders to lots of tasks, milestones, and deadlines. It gets easier to keep track of everything when it’s all in one place.
3. Visibility to plan your initial schedule
The most attractive thing about a Gantt chart is that it’s visual. You can display your chart on a large screen, and together with your team, brainstorm on your initial project schedule and workflow. You can easily drag and drop to reorder tasks as members suggest new requirements, dependencies, and milestones.
Because everything is right in front of you, you can also easily see—in actual perspective—how much work can occur at once and how long the work and overall project will take. This visibility can help determine how much resources are needed and the most realistic deadline expectations for your project.
4. Keep all stakeholders updated
Regular updates are essential as they keep teams informed of the progress. Moreover, with apps like Mission Control, stakeholders can view changes and updates to your Gantt chart in real-time. This functionality helps to keep everyone on the same page.
5. Identify issues before they escalate
Most project management software color-codes bars within the Gantt chart based on activities or progress. Any delayed tasks will automatically pop out, enabling you to identify what’s causing the delay and address it before it’s too late.
6. View baseline versus actual progress
If your project management tool supports a baseline feature, you will quickly see how your actual project progress compares to the original plan. Hence, you’re able to see how well projects are developing. If there are any delays, you’ll also be able to see where they’re coming from.
7. Team collaboration
With a Gantt chart, it’s easier to oversee, adjust, and share project schedule information in one dashboard. This functionality makes collaboration and communication within the team faster and easier. For instance, when you adjust assignees or dates within your Gantt chart, the team will be automatically notified of the changes. Teams can also view progress and keep tabs on their upcoming work without coming to you for updates.
8. Effective resource allocation and management
In addition to capturing deliverables against a timeline, Gantt charts also allow project managers to identify the resources they need to deliver projects. Understanding a project’s resource requirements is essential during the planning stages as it will enable managers to source and allocate resources effectively.
Additionally, with tools like Mission Control, managers can set up their Salesforce Gantt charts to automatically schedule or reschedule a task to take weekends, public holidays, and leave days into account. It becomes easier to manage resources and ensure projects progress smoothly with such capabilities.
Must-Have Salesforce Gantt Chart Software Features
These are some vital features that you should look for when evaluating a Gantt chart tool:
1. Milestones
Milestones allow you to see how far you are from project delivery. A milestone marks the end of an event, task sequence, or project phase. Milestones are significant for tracking progress, generating momentum, and keeping teams engaged. Hence, the ability to set milestones and delete or edit them as necessary on your chart is vital.
2. Integration with Salesforce tasks
Another critical feature to consider is integration with native Salesforce Tasks. With this feature, whenever you assign a project task to a user, the app automatically creates a corresponding Salesforce task for them as well.
Your team could already be using the Salesforce Tasks feature to create To-Dos, reminders, send proposals, and more. You don’t want them to keep launching a separate app every time they work on their project tasks. Having all of their personal and project assignments in one familiar place saves time and keeps them focused.
3. Summary tasks
When using the waterfall method, your project could be running in phases. Each phase has its tasks and subtasks. Thus, your Gantt chart must support summary tasks. A summary task is an ‘umbrella’ task above various individual tasks. Summary tasks allow you to group activities, especially as part of a project stage or phase. You can hide tasks from view so that only the summary task is shown.
4. Dependencies
Dependencies on a Gantt chart shows which tasks are linked together and when a task should begin or end in relation to other tasks. Some will need to start simultaneously and run concurrently (start-start), while others will start only when another action finishes (finish-start). Mission Control automatically adjusts the timings of all related tasks if there is a change to an action with dependencies. This allows you to see the instant effect of a change and plan accordingly.
5. Project cloning
Instead of setting up a separate chart each time you start a similar project, you can clone your Gantt chart and customize it where necessary. Cloning makes your work much more efficient. With Mission Control, you can clone an existing Gantt chart to replicate key actions, tasks, and timings for a project’s delivery. Thereby saving time, and project managers don’t have to remember and plan for all project intricacies upfront.
6. Baseline dates
It’s vital to track your actual progress and see how it compares with your initial plan. Doing so enables you to know if the project is on track as envisioned or not. You can only make this comparison if your chart allows you to view baseline dates.
Get Started with Salesforce Gantt Chart Software
Gantt charts can transform how a business manages project delivery thanks to their simplicity and visual power. With the ability to visualize how much work can be done at a go and how long it takes to get it done, project managers can set realistic deliverables and timelines.
Mission Control’s interactive Gantt chart allows you to streamline your project management by helping you keep track of all your activities within Salesforce. You can log multiple projects so you can see at a glance how they all fit together and adjust and manage elements of your project as you go.
If you’re looking to manage your projects more effectively, Mission Control’s Salesforce Native Project Management Software has a variety of features that will help you organise, run and automate many of your project tasks. Chat with our experts today.