Love it or hate it, the trusty Gantt Chart is synonymous with Project Management. A concept developed in the late 19th century to manage a project delivery against a timeline, it has evolved somewhat over the years. Gone are the days of the large format, wall mounted Gantt charts with little room for change, instead replaced by online and interactive versions far better suited to today’s fast paced business world. When used effectively, Gantt charts should underpin and ultimately drive a project’s successful delivery. So, it’s pretty imperative to build a solid Gantt chart from the offset. In this article, we take you through some of the key factors to consider to ensure your Gantt chart delivers every time.
What is a Gantt chart?
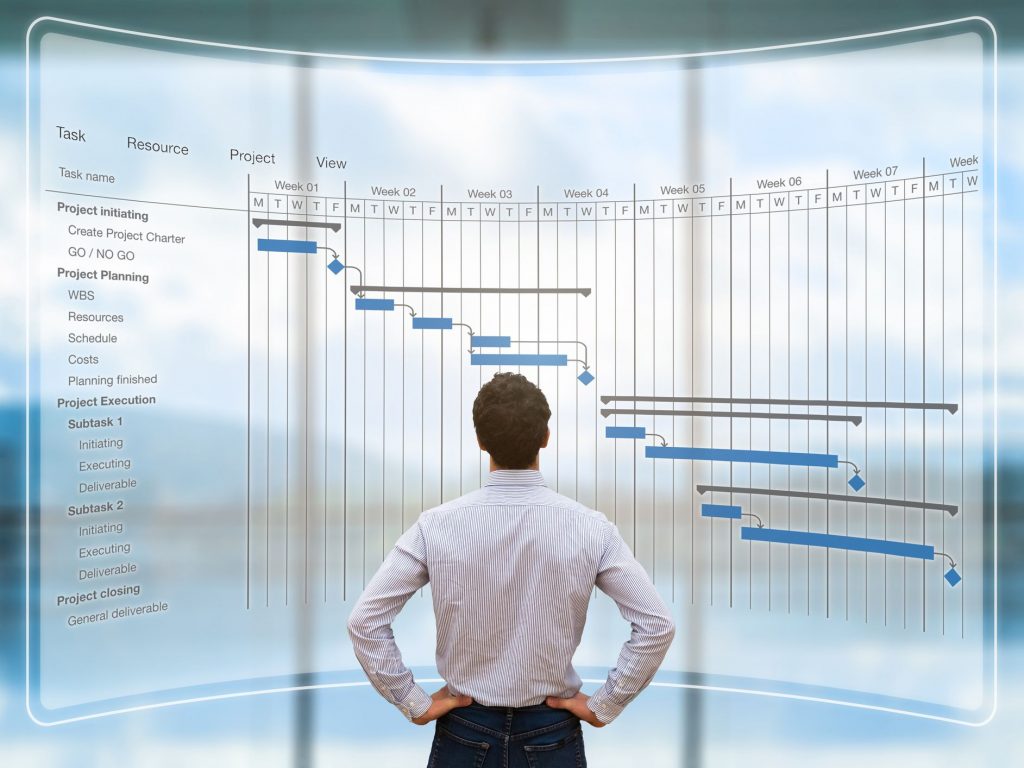
In a nutshell, a Gantt chart acts as a visual timeline of your project. It gives full insight into when everything across a project needs to be delivered. A Gantt chart can be used to organize a project, improve visibility and keep a project team on track. Not all are created equal – for more details on Mission Control’s Gantt chart tool and how it supports project management – read more here.
Ultimately how well a Gantt chart supports your project delivery, will depend on the quality of the information you’re putting into it. The more considered and detailed the information, the more useful the Gantt chart will be. Thankfully with cutting edge software, it no longer falls to Project Managers to consider how the Gantt chart information should best be visually presented, that is the job of the software. Just input your project details and allow the software to create the Gantt chart for you. But how best do you compile that information? Well at Mission Control, we’ve built a few in our time! Here’s how we approach building a Gantt chart for consistently smoother project delivery:
1. Take time upfront
The first 15% adage certainly rings true for project management – that is, the first 15% of your project preparation will directly determine how the remaining 85% plays out. So, allow time and space to build out your project plan which will feed directly into your project’s Gantt chart. It can be easy to want to jump into the action but preparation and planning upfront will always pay dividends once a project is underway. This project preparation can be made more efficient by utilizing a previous project’s IP. At Mission Control, for similar projects we simply clone an existing Gantt chart to replicate key actions, tasks and timings for a project’s delivery. This saves time whilst also taking pressure off the Project Manager to remember and plan for all project intricacies upfront.
2. Define the project objective
What is the project setting out to achieve? Another way to frame this is ‘what does success look like?’ Your entire Gantt chart will be built around achieving this. It’s imperative that this is defined upfront but arguably even more important is that all project stakeholders share the same expectations of a project before it begins. For some industries, the output is clearer than others, for example construction. Cue building! In professional services, it may need a little more exploration (and communication) of exactly what is included in a successful project delivery – whether that’s a marketing campaign, a rebrand or a financial strategy. Clearly defining the project goal will inform how delivery is focused and actions are prioritized within the Gantt chart.
3. Establish the project timeline
Start at the top: When is the project starting and when is the final deadline for all elements to be delivered? These become your ultimate boundaries for your Gantt chart. Of course, these may change at either end and that’s ok. All key milestones, actions and tasks on the Gantt chart will sit within the start and end date, with flexibility for specific changes as a project unfolds. Most importantly, if they do, you’ll be able to see straight away the implications on the wider project. A good interactive Gantt chart should also allow you to compare baseline timings (original) against actual timings. These learnings can then be used to inform future projects and may in turn become new baseline timings, depending on the reason for any variations.
4. Identify milestones
Think of milestones as regular signposts or landmarks to let you know how far you are from your destination. Not actions as such, but markers along the way. They can be great for engaging a team, tracking progress and generating momentum. Milestones can coincide with project phases and can trigger other actions such as automated invoicing when a milestone is met. Within a Gantt chart, they can be a great way to quickly see how a project is tracking without getting into the detail.
5. Define key project phases
These are like the mini projects / sprints within your overall project – think of them as the manageable bite-size project pieces to help you clearly progress between milestones and move closer to the end goal. If the end goal is to build and launch a website, key phases (actions) might be; create sitemap / design wireframe / create content / web design / test site / launch. Within each action there will be a list of tasks / checklist items that need to be completed before an overall action is delivered. By visually representing these within the Gantt chart, a Project Manager can see where activity may be concentrated, and resource demands higher.
6. Understand dependencies
It would be very unusual to have a project where there was no relationship between certain actions or milestones. A waterfall project is a perfect example of dependent actions; one action needing to be completed before the next one can commence. Consider what project actions are dependent on each other: Some will need to start at the same time and run concurrently (start-start), some will start only when another action finishes (finish-start). Some actions might be dependent on a milestone, not an action per se. By identifying these dependencies, your Gantt chart will work harder. At Mission Control, if there is a change to an action with dependencies, it will automatically adjust the timings of all related actions. This allows you to see the instant knock-on effect of a change and to then plan accordingly – a powerful tool for any Project Manager!
7. Know your resource
A Gantt chart isn’t simply deliverables against a timeline, it also captures the project resource that’s working hard to make it all happen. Knowing available resource upfront and allocating actions and time to them, is important to capture in the planning stages where possible. The Gantt chart should be able to factor in part time vs full time resource, leave, public holidays and of course, a resource’s other commitments to other projects. Only with allocated resource will the Gantt chart give a complete view of a project and how it will roll-out. For a holistic view across an organization, ensure your Gantt chart allows multiple projects to be run through it. This gives bigger picture information showing current workload, (and upcoming) and help identify any bottlenecks or pressure points across the organization.
With all these factors considered and captured, a Gantt chart should then identify a project’s critical path – that’s the longest sequence of tasks that must be completed in order to deliver a project. This is essential information for a Project Manager – not only for the effective management of a project roll-out but to inform ongoing communications to the project team and to stakeholders.
When used effectively, Gantt charts can transform the way a business manages project delivery. Mission Control is a comprehensive Salesforce Project Management software application. To learn more about our suite of project management tools to support your business, chat to our expert team today.