
The project manager’s job is getting more demanding as projects get larger and more complex. The more complex the project, the more activities will be involved. It can be challenging to ensure all these activities are completed in good time and produce the desired outcomes.
Proper project scheduling techniques and tools can make managing complex projects more manageable. The precedence diagramming method (PDM) is one such assistive tool.
This article gives an overview of the precedence diagramming method, including how to draw a PDM diagram, its benefits, and how you should use it in project management.
What is the Precedence Diagramming Method?
The precedence diagramming method (PDM) is a project management graphical tool used to develop a project schedule according to a project plan. The process involves creating a PDM diagram that illustrates critical paths and dependencies. The diagram uses nodes to display activities and links them with lines and arrows to represent the dependencies.
The precedence diagramming method allows the project team to understand all the scheduled activities and how they relate to each other.
With a schedule network diagram, a project team can identify and visualize the sequence and dependencies of activities in an entire project, a workstream, or a work package.
The PDM model illustrates four types of dependencies—also referred to as logical relationships— that we introduce in the next section. These dependencies are the relationship between successor and predecessor activities and are shown as nodes in the PDM diagram.
Types of PDM Dependencies
As mentioned, project managers can map out four types of dependencies within the PDM diagram. These are:
- Mandatory dependency: This is also referred to as hard logic. This type of dependency is crucial to the completion of project activities. Activity A must be completed in this dependency for activity B to start. A good example is if a company is if a phone company is testing a new screen, testing cannot be done before the screen is developed.
- Discretionary dependency: Also referred to as preferential or soft logic. In this dependency, the activities are controlled by the project team. The activities remain the same, but the order of completion can be changed.
- External dependency: This dependency comes from external influences such as government laws and regulations needed before a project can start.
- Internal dependency: This results from a precedence relationship between project activities. Here, activities can’t begin until the previous project is completed.
Advantages of Precedence Diagramming Method
There are several benefits of using PDM, including:
- Project managers can map out a precise and proper sequence of project tasks and activities. This enables them to create an accurate project schedule.
- Project teams can quickly see which activities are critical and prioritize those activities and assignments.
- Enables project managers to communicate visually and update teams and stakeholders more quickly and accurately.
- Easier identification of missing activities so you can develop an accurate project schedule.
Precedence Diagramming Method Example
This precedence diagramming method example analyzes the basics to help you understand the whole process.
Assume you’re the project manager in an IT project that involves designing, developing, implementing, testing, and deploying an IT solution. First, identify activities and assign a duration to each. While doing this, identify the activities with a critical path. Then find and connect dependencies to ensure the workflow is in order of priority.
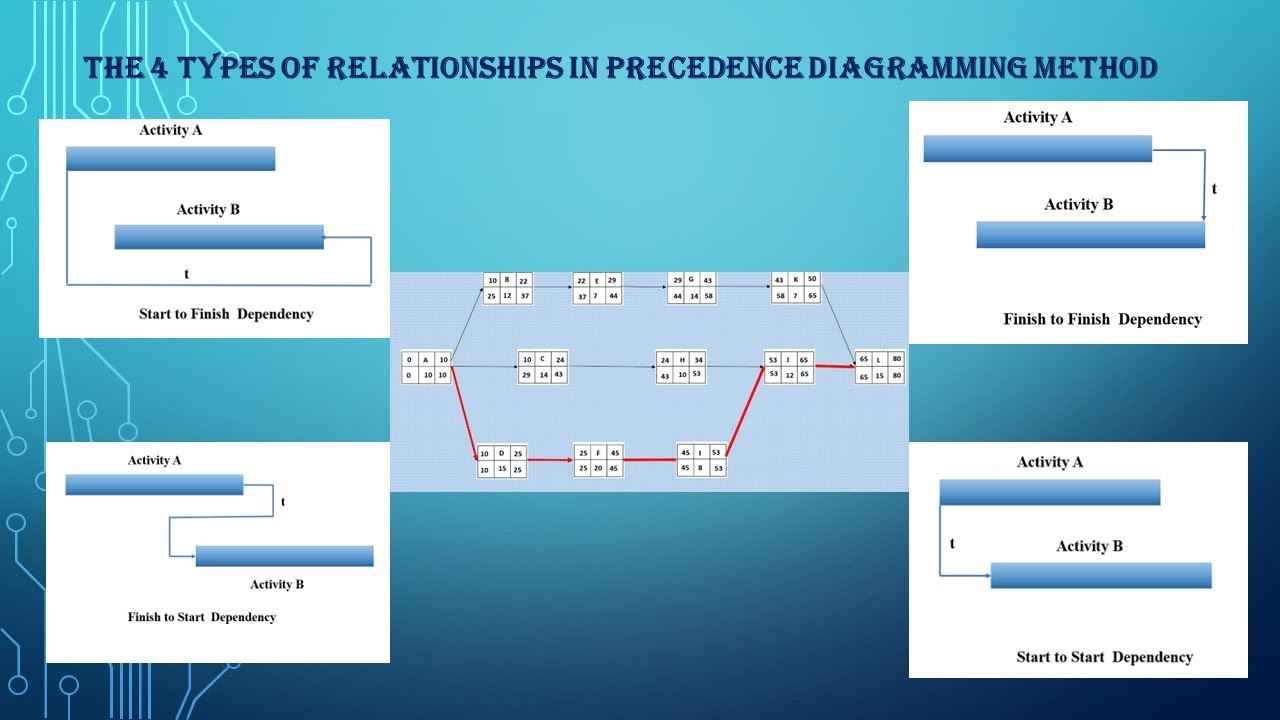
You need to map out the four possible relationships when finding the dependencies. These are:
- Finish-to-Start (FS): Teams can’t work on module B before module A is completed.
- Start-to-Start (SS): In this relationship, module B can only start after module A starts.
- Finish-to-Finish (FF): Here, module A cannot be completed until module B is completed
- Start-to-Finish (SF): In this case, module A must start for module B to be completed.
Activities in your IT project will likely fall in one of the four relationships.
Precedence Diagramming Method Diagram vs. Gantt Chart
PDM diagrams and Gantt charts are popular project scheduling tools. Though fulfilling a similar goal, the two tools are different.
The Gantt chart distributes project tasks on a timeline, while PDM network diagrams illustrate how a project’s tasks connect.
Gantt and PDM charts reveal who’s responsible for scheduled activities and the workflows necessary to complete them.
Gantt charts list activities listed in a spreadsheet fashion. In contrast, precedence diagramming is more visual and contains nodes and arrows showing the sequential order of tasks.
Teams find Gantt charts more helpful when tackling tasks and timelines during ongoing projects. At the same time, precedence diagrams are more valuable during the project planning phase.
How to Create a PDM Diagram
Below are a few steps that articulate creating a precedence diagram:
- Step 1: Break your Work Breakdown Structure (WBS) into activity levels and place the top deliverable onto the right-hand side of your board or paper.
- Step 2: List all activities in the order they need to happen.
- Step 3: Add relationships and dependencies to each activity in your table.
- Step 4: Draw the diagram.
Why Use Precedence Diagramming Method in Project Management?
The Precedence Diagramming Method provides project managers with a powerful tool for scheduling and controlling their projects. The method enables managers to visually portray project activities and relationships among the activities. With this powerful visualization, project stakeholders can determine the project’s critical path, predict shortages, and identify how to reallocate resources to solve any problems.
Furthermore, project managers can easily update and rework their project schedules by using readily available project management software such as Mission Control. This gives managers control over activities and schedules.
Mission Control gives you a reliable avenue to organize project plans and schedules to help you create precedence diagrams quickly. With an in-built Gantt chart, you can define all the tasks needed to complete the project. Then, add them to your chart and evaluate if they fall into the critical path or have dependencies.
The Kanban board is a reliable feature to help you organize activities in the precedence diagram in order of priority. It also makes it easier to assign due dates and track timelines.
Mission Control is a comprehensive Salesforce Project Management software application. Make sure you check out our other Project Management Best Practices.
Contact us today to see how Mission Control can help you organize and schedule your projects better.