How it helps your project management
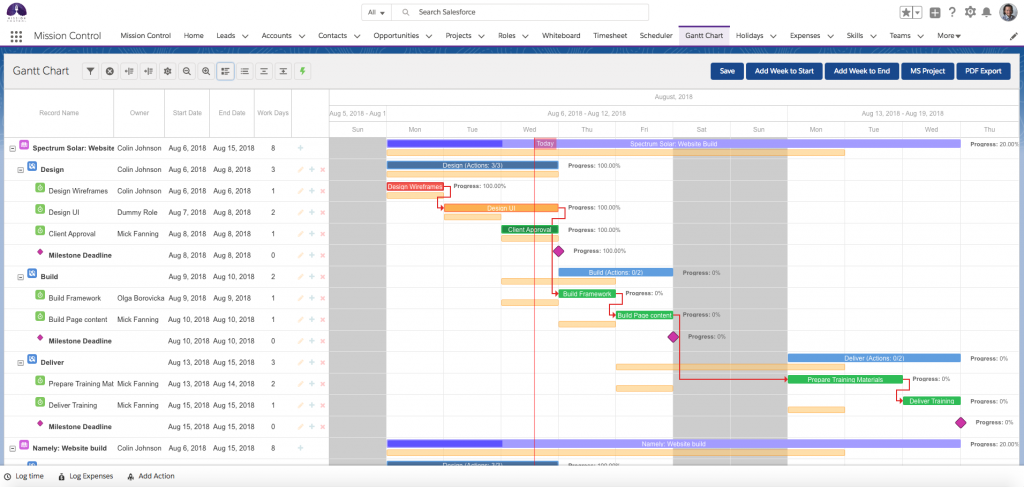
A Gantt chart, named after Henry Gantt who popularised this type of chart, is one of the most commonly used methods of displaying activities and time lines for project management. This chart uses bars to indicate activities and time lines. You list all your activities or events on the left axis and your time line across the top axis.
With a Gantt chart, you can see on a single page:
- Each activity
- The beginning and end of each activity
- Where activities or events overlap or intersect.
A Gantt chart also allows you to define the (ideal) start and finish dates of your project.
When the Gantt chart was first developed in the 1890s, the whole schedule was written out on large chart pages. Making changes was time-consuming and difficult, as you’d understand from your own project management activity. One change in one activity can easily affect many other activities, so more often than not, every change meant that the owner had to redo the whole chart.
Project management software
These days, you’ll find that many companies have developed project management software that allows you to make changes easily, changes that flow through to update all the activities that are dependent on that particular activity.
Once you learn how to set up and run your Salesforce Gantt chart within our Mission Control solution, you’ll be able to keep track of all your activities, update your chart, and print it out for offline reference.
What you can do within a Gantt chart
It will allow you to:
Plan your project schedule
You can set your beginning and end dates so all your project managers can schedule their own tasks to fall within the defined dates.
Set up dependencies
A dependency refers to any task that is dependent on another task. Consider a construction project, where a changed date of delivery of building materials will affect the timing of other tasks that depend on that delivery.
Schedule your project milestones
When you’re managing a large project, it’s helpful to know when you’ve reached a significant milestone so you and everyone on the project understand how the project is tracking. A Gantt chart allows you to set your milestones, along with any associated tasks, as well as adding, deleting or editing milestone tasks.
Reschedule tasks
Using the drag-and-drop feature , you can drag and drop tasks to reflect changes in the schedule.
View baseline dates
You can view baseline dates, which allow you to do an ‘actual’ versus ‘baseline’ comparison.
Export your file
Export your Salesforce Gantt chart as an .xml file to Microsoft Project or export it as a PDF to share with a client.
Clone your project
Instead of setting up a separate chart each time you start a similar project, you can clone your Gantt chart and customise it where necessary.
Manage multiple projects
Within Mission Control, you have the ability to log multiple projects so you can see at a glance how they all fit together and allocate resources.
Edit details for key actions
Simply double click to open key actions, and edit easily – from owner to timing – from within the text box.
Add new milestones or actions
Add milestone deadlines or add other actions with a few clicks.
Manage weekends and holidays
You can easily set up your Salesforce Gantt chart so it automatically schedules or reschedules a task to take weekends into account, or allows for a resource being on leave.
View or hide data tables
Hide the entire data table, or choose which elements you want to view.

Do you need more information on using the Salesforce Gantt chart within Mission Control?
The above is an overview of the benefits of using Gantt charts in your project management. To learn more about how a Gantt chart can streamline your project management, view our helpful video, or feel free to get in touch.


