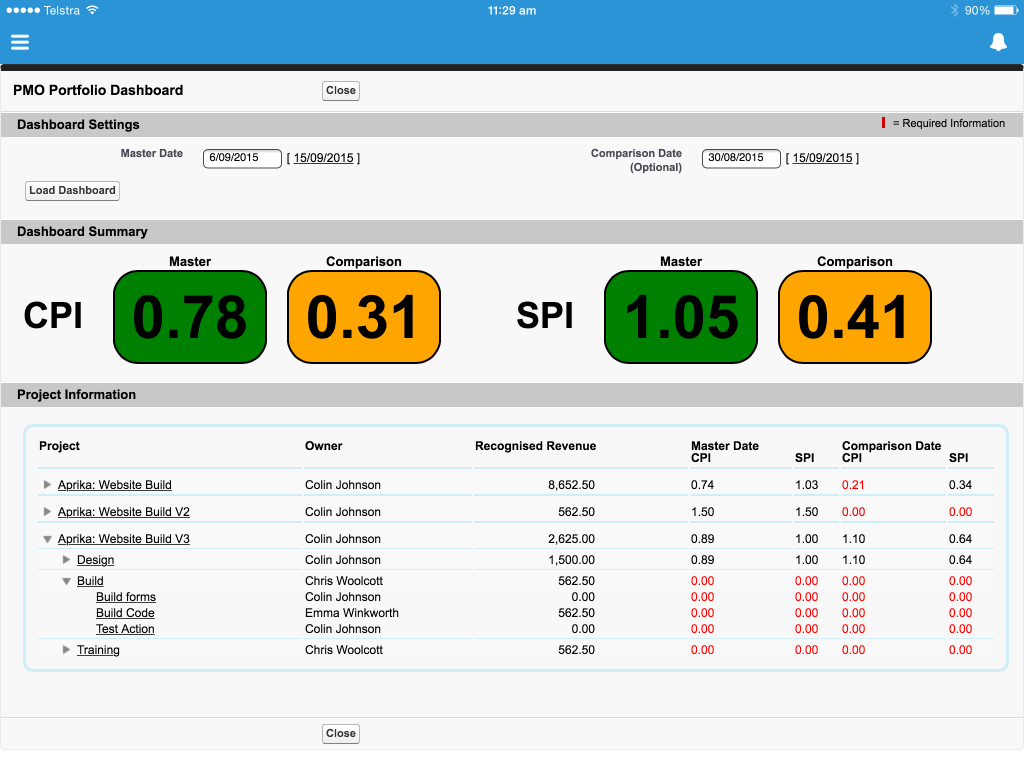
If you’re as passionate about Project Management as we are here at Aprika, you’ll no doubt be as equally excited by the new Project Management Office (PMO) Dashboard that we’ve recently added to Mission Control.
The PMO Dashboard uses six key metrics to provide you with a high level view of how all of your projects are performing. Before we jump into the features of the PMO Dashboard, let’s take a closer look at each one of these metrics.
The two main factors to look at when assessing how a project is performing are Budget and Time. The six ‘Key Performance Indicators’ we use to evaluate these two factors are:
• Planned Value (PV)
• Earned Value Formula (EV)
• Actual Cost (AC)
• Recognised Revenue (RR)
• Cost Performance Index (CPI)
• Schedule Performance Index (SPI)
Let’s delve a little deeper into the meaning behind each of these.
Planned Value
The Planned Value or PV is the percentage of revenue you are planned to earn during the period you are evaluating. For example, if an action on your project accounts for $1,200 revenue and has a Start Date of 21st September and an End Date of 30th September, the total working days for this action is eight.
If we were assessing week 1 of the project the PV would be $756. This is calculated based on 5 days (working days within the assessment period) divided by 8 days (total working days for the action) multiplied by $1,200 (e.g. 5/8 = 63%, 63% x $1,200 = $756).
Earned Value Formula
The Earned Value Formula identifies how much revenue has been earned based on how much of the work has been completed as a result of the effort expended to date.
For example, if you are 40% of the way to having the action completed, the EV would be $480 (e.g. 40% x $1,200 = $480).
Actual Cost
The Actual Cost identifies how much of the revenue has already been used in achieving the current completion percentage.
For example, if four hours have been completed and the billable hourly rate is $150, the AC would be $600.
Recognised Revenue
The Recognised Revenue identifies how much of the total revenue due to be earned has been recognised so far, based on the completion percentage.
For example, if we are working on a fixed price project and the action budget is $1,200 and the completion % is 75%, the RR would be $900.
Cost Performance Index
The CPI identifies how close to budget the project is performing at. The Earned Value Formula and the Actual Cost are used to determine the Cost Performance Index. The formula is EV / AC = CPI. If the result of this formula is 1.0, then your project is running exactly to budget. If it is lower than 1.0 you’re running over budget and if it is over 1.0, you’re likely to deliver the project under budget.
Schedule Performance Index
Similar to CPI, the SPI identifies how well the project is performing against the delivery schedule. The Earned Value Formula and the Planned Value are used to determine the Schedule Performance Index. The formula is EV / PV = SPI. If the result of this formula is 1.0, then your project is running exactly on schedule. If it is lower than 1.0 you’re likely to miss your deadline.
The PMO Dashboard within Mission Control lets you view these KPIs at the click of a button. You can select the point in time you wish to evaluate the data snapshot, as well as being able to select a secondary date for comparative purposes.
The Dashboard Summary section provides an overall CPI and SPI rating across all projects.
You can also drill down through the projects, milestones and actions to review the detail. Within a few clicks, we’re able to see how each project is performing.
You can find out more about Mission Control here: www.aprika.com.au/mc-support
The Mission Control ‘PMO Dashboard’ provides you with a high level view of your core project KPIs. Mission Control is a comprehensive Salesforce Project Management software application.


