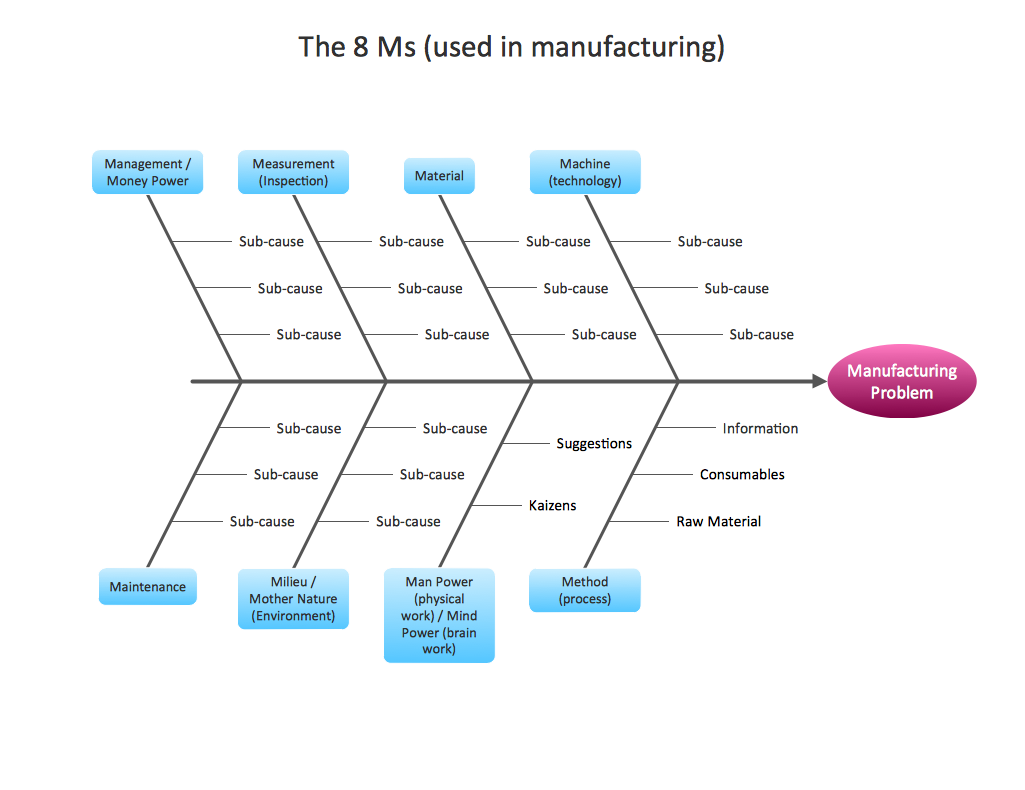
Also called Fishbone diagram, the Ishikawa diagram is a graphic technique that’s used for displaying possible causes of an effect. It is often used in manufacturing and product development to outline the different steps in a process, demonstrate where quality control issues might arise, and determine which resources are required at specific times.