A mathematical graph that represents cumulative cost plotted against time. The cost curve is used to measure project work progress, evaluate performance, and make cash flow estimates.
Salesforce Project Management Software by Aprika

Ready for take off? Click below and take a look around with your free 14 day trial.
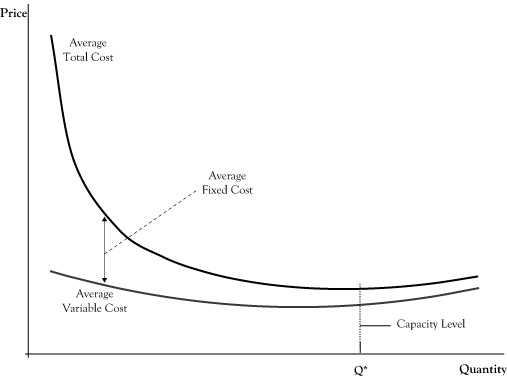
Definition;
A mathematical graph that represents cumulative cost plotted against time. The cost curve is used to measure project work progress, evaluate performance, and make cash flow estimates.

A knowledge base of key content resources on project management and professional services automation.

Browse through all our recent articles on business, technology and project management.

A quick guide on each of the key features of Mission Control’s project management platform.
©2026 Aprika Business Solutions Ltd. All rights reserved.
Simply enter your email address below, and we will set you on your way to your Free Trial. Enjoy the ride!
Simply enter your email address below, and we will set you on your way to your Free Trial. Enjoy the ride!