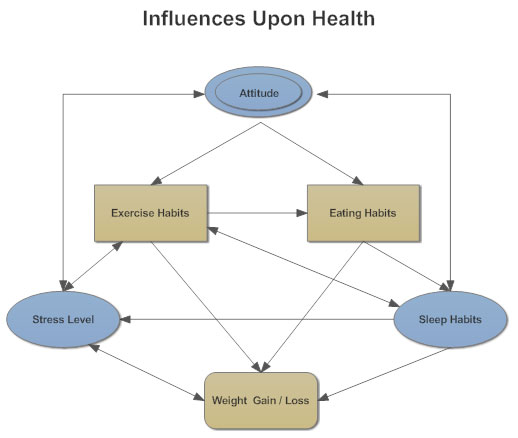
An influence diagram is an intuitive visual display of a decision problem. It depicts the key elements, including decisions, uncertainties, and objectives as nodes of various shapes and colors. This is a graphical representation of the causal relationships between variables and outcomes.